Online River, Stream, Pond, Lake Ammonia (NH3) Monitoring Solution
Product Description:
Excessive ammonia in the stream and rivers has raised the fear of ammonia toxicity in the water which has very high impact on factories continues operation. Hence monitoring and studying the pattern of ammonia contamination is essential. With our cost effective solution which is capable of collecting the sensor data and alert whenever the ammonia toxicity rate is trending toward the worrying stage.
Sensor

AP

Cloud

Clients
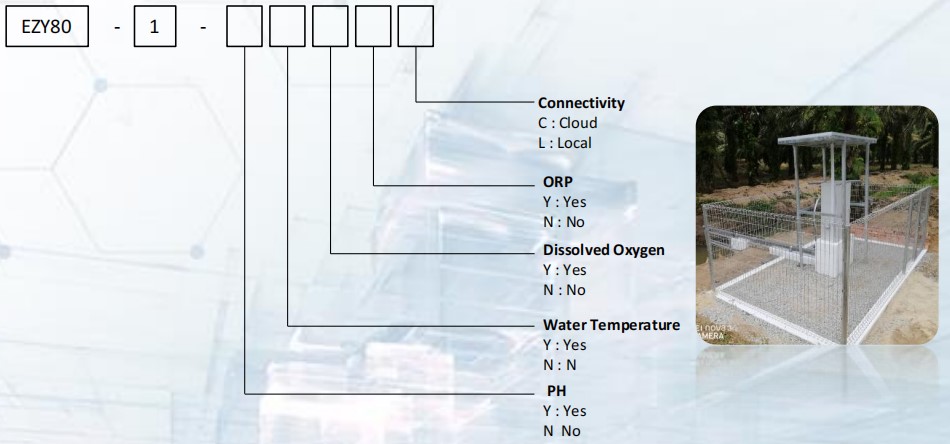
Product Parameter
| Product No. | EZ80-01 |
|---|---|
| Wireless Features | SMS, 3G/4G |
| Electrical Features | 24 VDC |
| Material | Polypropylene Body |
| Sensor Characteristics | NH3 Ion Sensor (Accuracy: +-0.2C, Range: 0 to 50 ppm) |
| Temperature Compensation | 0 to 90C |
Add On
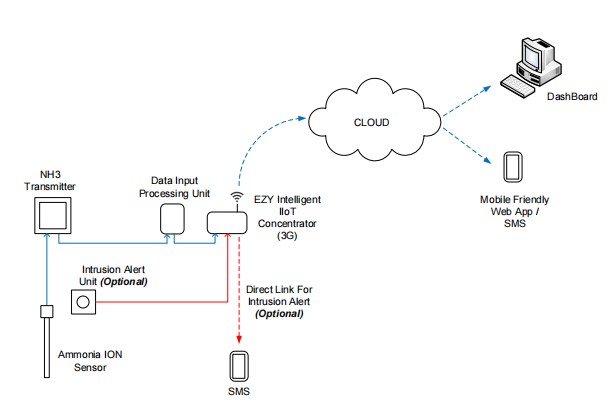
Overview System Diagram
Diagram below describes the overall system setup. The system utilizing a VPS (Virtual Private Server) with dedicated IP address to store csv data and host the standard mobile friendly dashboard.
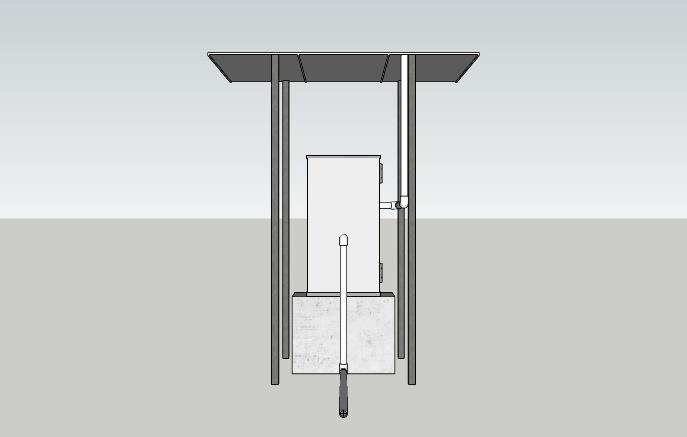
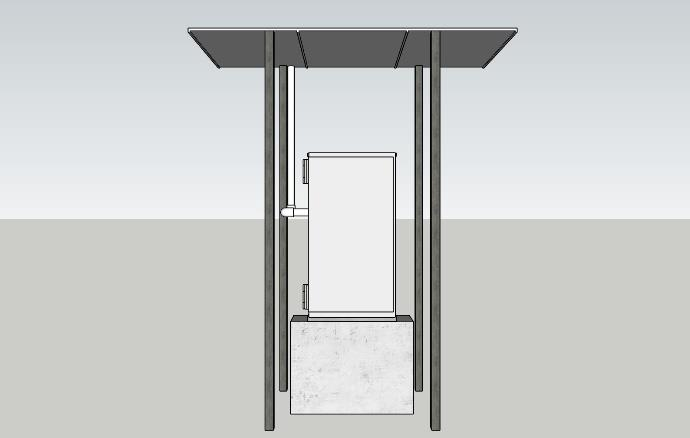
Ammonia Remote Station 3D Diagram
 Back View
 Front View
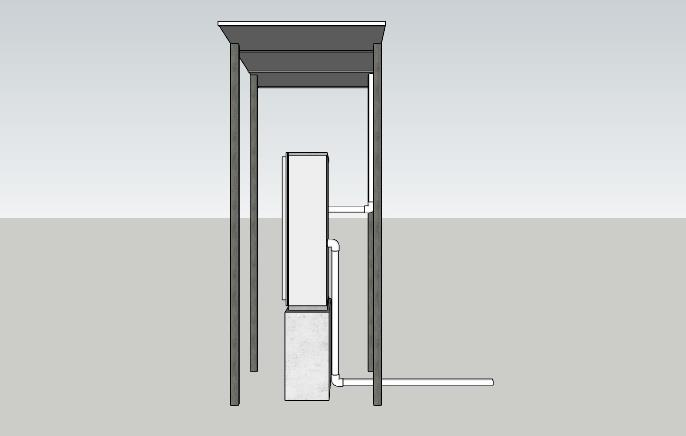 Left View
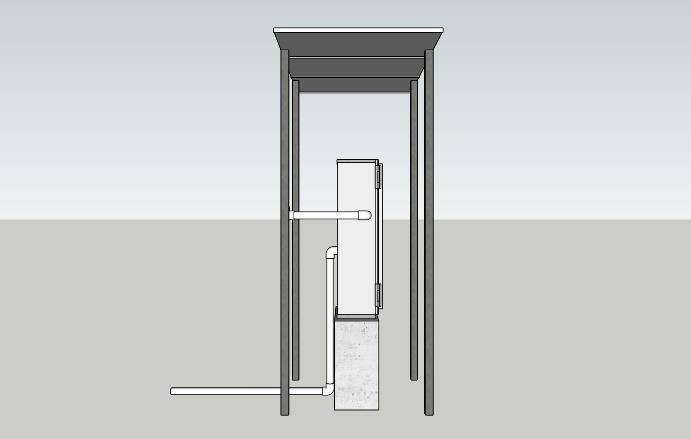 Right View
 Top Plan View
ONLINE SOFTWARE & MOBILE NOTIFICATION
The Dashboard Screenshot
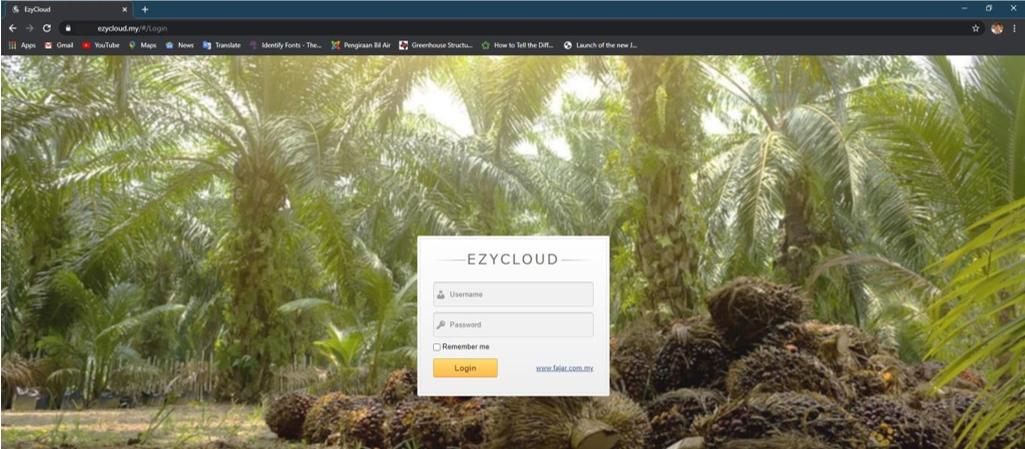
Login Screen
Main Dashboard
Upon successful login, the page as shown on the screen shot loads up. This is the main page where the display is updated hourly. However, any status change at site station such as ammonia level is above threshold, sensor water is low or intrusion detected, the site station will respond immediately and the dashboard will be updated instantaneously and the telegram alert issued.
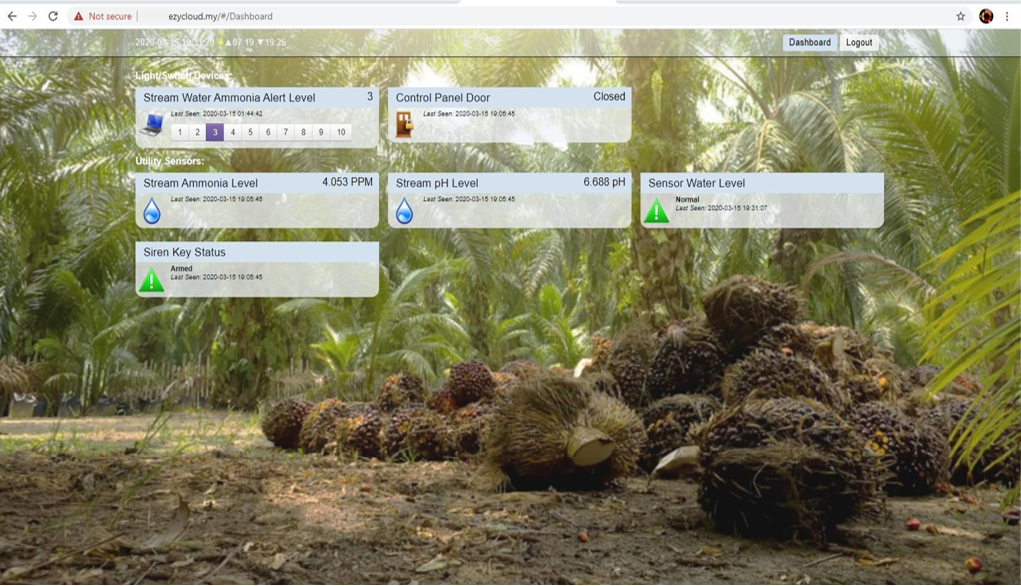
Main Dashboard
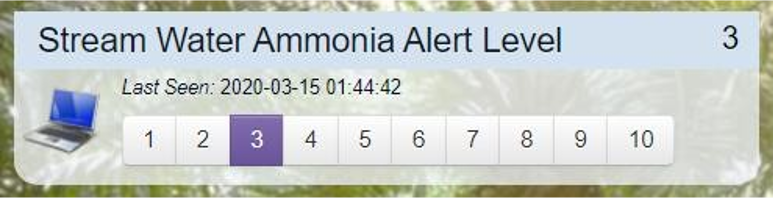
Dashboard Widget: Stream Water Ammonia Alert Level
The screen shot below is the ammonia set point configuration widget. A set point within 1 to 10 can be selected. Upon confirmation the set point will be updated to site station 4G Gateway, which will use this set point as comparing threshold value to issue alerts.
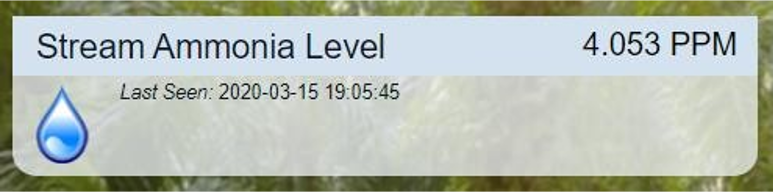
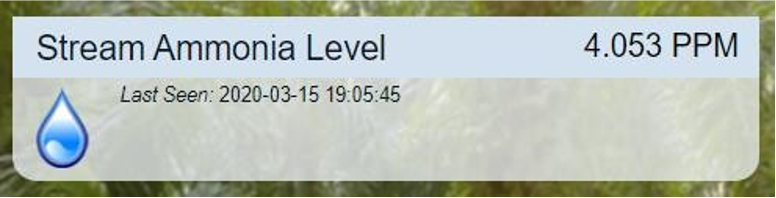
Dashboard Widget: Stream Ammonia Level
The screen shot below is the stream ammonia level display. This display will be updated hourly and the values will be automatically logged for download and chart trending.
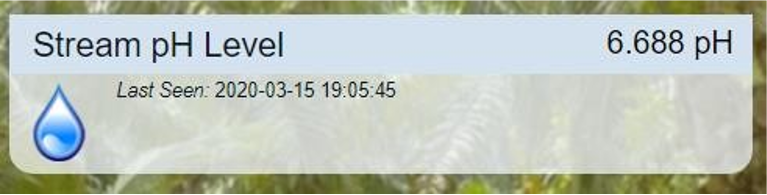
Dashboard Widget: Stream pH Level
The screen shot below is the stream pH level display. This display will be updated hourly and the values will be automatically logged for download and chart trending.
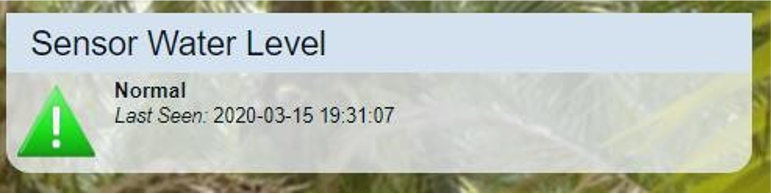
Dashboard Widget: Sensor Water Level
The screen shot below is the sensor water level display. This display will be updated when the status changes instantaneously. The message displayed is Normal of Low.
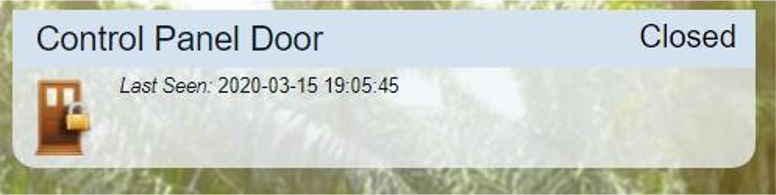
Dashboard Widget: Control Panel Door
The screen shot below is the control panel door open close status indicator. This display will be updated when the status changes instantaneously. The message displayed is Open or Closed.
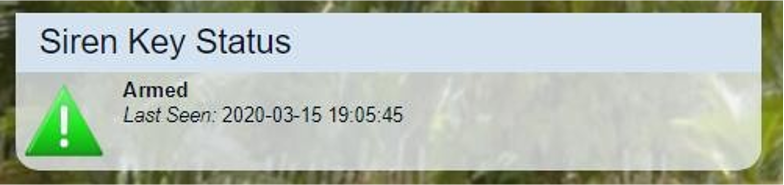
Dashboard Widget: Siren Key Status
The screen shot below is the siren key status indicator. This display will be updated when the status changes instantaneously. The message displayed is Arm or Disarm.
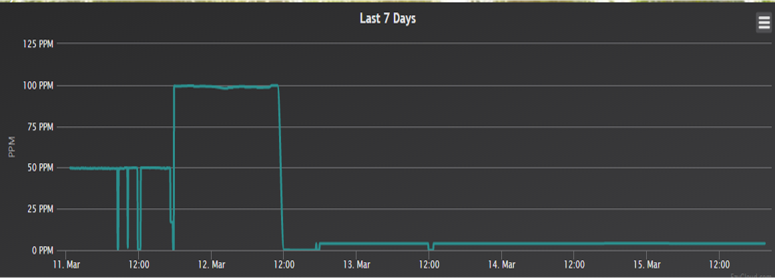
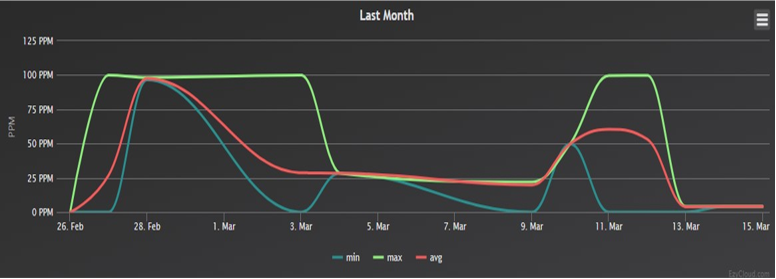
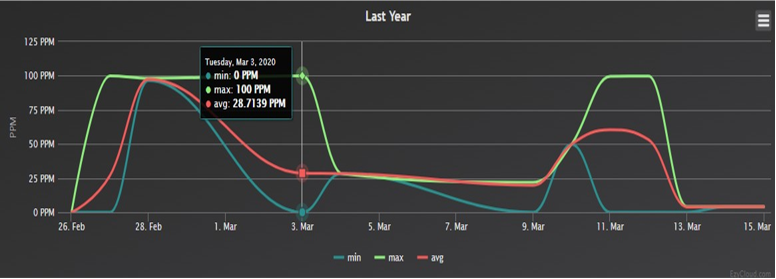
Dashboard Widget: Data Logs and Charts
The screen shot below is the sensor water level display. This display will be updated when the status changes instantaneously. The message displayed is Normal of Low.
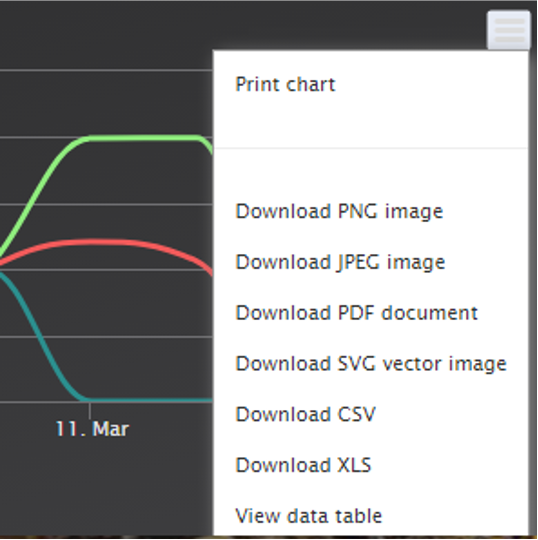
Dashboard Widget: Download Data
By clicking on the 3 horizontal line icon, a pull down menu will drop showing the option of data download.